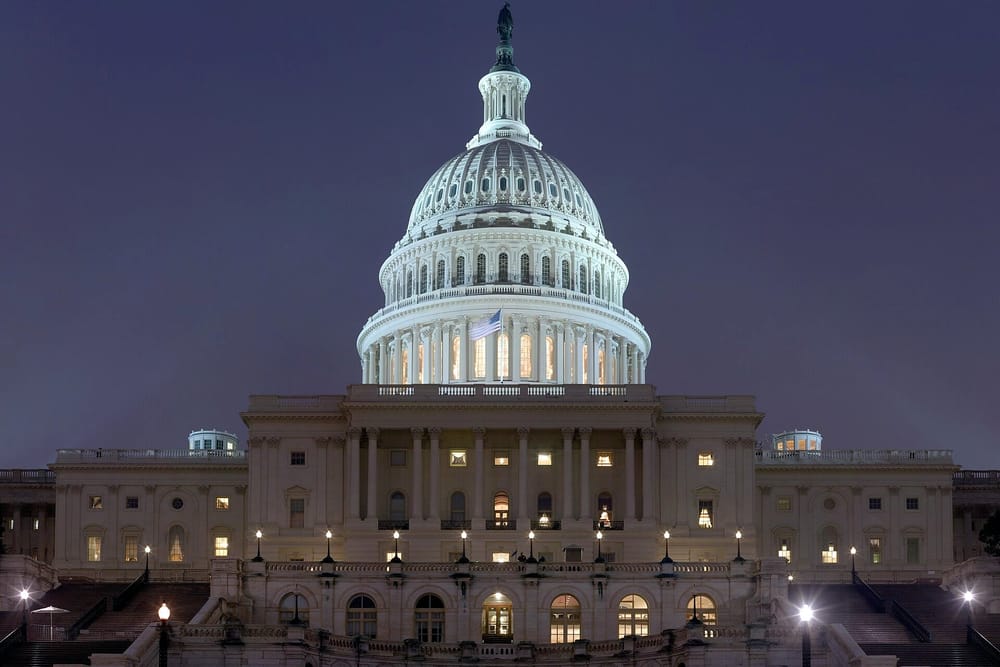
On paper, the national picture is clear. In the 40 districts that will decide control of the chamber, it is anything but. Dispatch analysed district-level polling, turnout history and the effect of recent boundary changes to understand why the headline numbers and the likely outcome are drifting apart.
The first reason is geography. Voters who are most dissatisfied are concentrated in a small number of already safe seats, which inflates national totals without moving the balance. The second is turnout: the voters who decide close races are older, more reliable and less likely to answer unknown numbers.
The third is the lines themselves. Five states redrew districts since the last election, and in three of them the new boundaries lean heavily to one side. Analysts say the net effect is worth about six seats before a single ballot is cast.
None of this means the polls are wrong, only that they are measuring something different from what determines who wins. “A national poll answers the question ‘how do Americans feel?’” said one analyst. “The map answers ‘who gets to govern?’ They are not the same question.”